Projects and runs
The projects and runs webpages can be found from the
Data menu, the latter contains two submenus, one for all projects and runs , the other is for curated projects .
There are four types of webpages for projects and runs.
All projects and runs 
This page provides statistics on the data collected in GMrepo, and lists all projects and runs in two tables, from the tables users can access webpages for details of a specific project or run.
It thus consists three parts:
1. Overview
This parts provides overview of data collected in our database. For example, the current release contains:
- Meta data for in total 71,642 runs (samples), belonging to 353 projects. Among which, raw data have been processed for in total 53,700 runs (samples), belonging to 282 projects.
- Among which, microbe abundance data are available for in total 37,550 runs (samples), belonging to 209 projects.
- In total 16,150 runs (samples), belonging to 159 projects failed our QC processes.
- In addition, GMrepo also includes information on 76 projects whose raw data were not processed, including in total 31,381 runs/samples, due to various reasons, mostly the lack of a clearly defined health/disease information.
2. All projects table
This table contains a list of collected projects, their associated diseases, related publications, brief descriptions and whether the rawdata have been processed.
The rawdata of a project will not be processed if it lacks certain essential meta-data. For example, GMrepo currently contains 76 projects whose raw data were not processed, correspondin to in total 31,381 runs/samples, due to various reasons, mostly because of the lack of phenotype information; uses can click the project id for details.
For example, project PRJNA682076 contains 666 samples/runs; it was not processed because host-related information were not available, including the disease/heath information, age, gender and BMI.
3. All runs table
This table contains a list of collected samples in GMrepo. Also available are meta-data including:
-
technical meta-data such as:
-
experiment type (16S or Metagenomics),
- sequencing devices / instruments, and
-
number of obtained sequencing reads.
-
Host-related, biological-relevant meta-data such as:
-
disease or health of the host (refered as to
phenotypein our database), - age,
- sex,
- BMI (body mass index), and
- antibiotic usage.
Meta data are available for in total 71,642 runs/samples.
A QCStatus (quanlity-control result) is available for each run, which can be one of the three values:
- 1: the data passed our QC procedure and the processed results (i.e., taxnomic assignments) have been loaded into our database,
- 0: the data did NOT pass our QC,
- (empty): data yet to be proccessed and loaded to our database.
Please consult Data processing & QC for more details.
project details page
The project details page is available for each collected project in GMrepo, and provides details on a project, including:
- included samples,
- associated disease(s),
- related publication(s), and
- disease marker analysis results
Here are some random examples:
1. Project overview
This part provides some basic information regarding a project, including:
- a brief project description obtained from public databases, mostly from ENA (European Nucleotide Archive) or NCBI SRA (Sequence Read Archive) database ,
- number of included runs,
- related publication(s), if available,
- whether the project is a curated project .
2. Included runs/samples
This part includes a table that contains a list of runs/samples included in the project. Similar to the All runs table, related technical and biological meta-data and QCStatus are also listed in the table. Please consult the All runs table section above for more details.
3. In-depth analysis
In-depth analysis so far includes only marker identification. Please consult our documentation on Disease marker identification for more details.
Briefly, microbial markers that show significantly differential abundances between:
- either a disease and the healthy control group, e.g., CRC and health,
- or two distinct stages of a disease, e.g., adenoma and CRC
are identified using LEfSe (Linear discriminant analysis effect size)
PMID: 21702898 .
In GMrepo, markers are identified on per-project basis, thus the analysis results are included in this project details for each project.
In addition to be shown in a data table, the LEfSe results are also visualized in a barplot, as shown below:
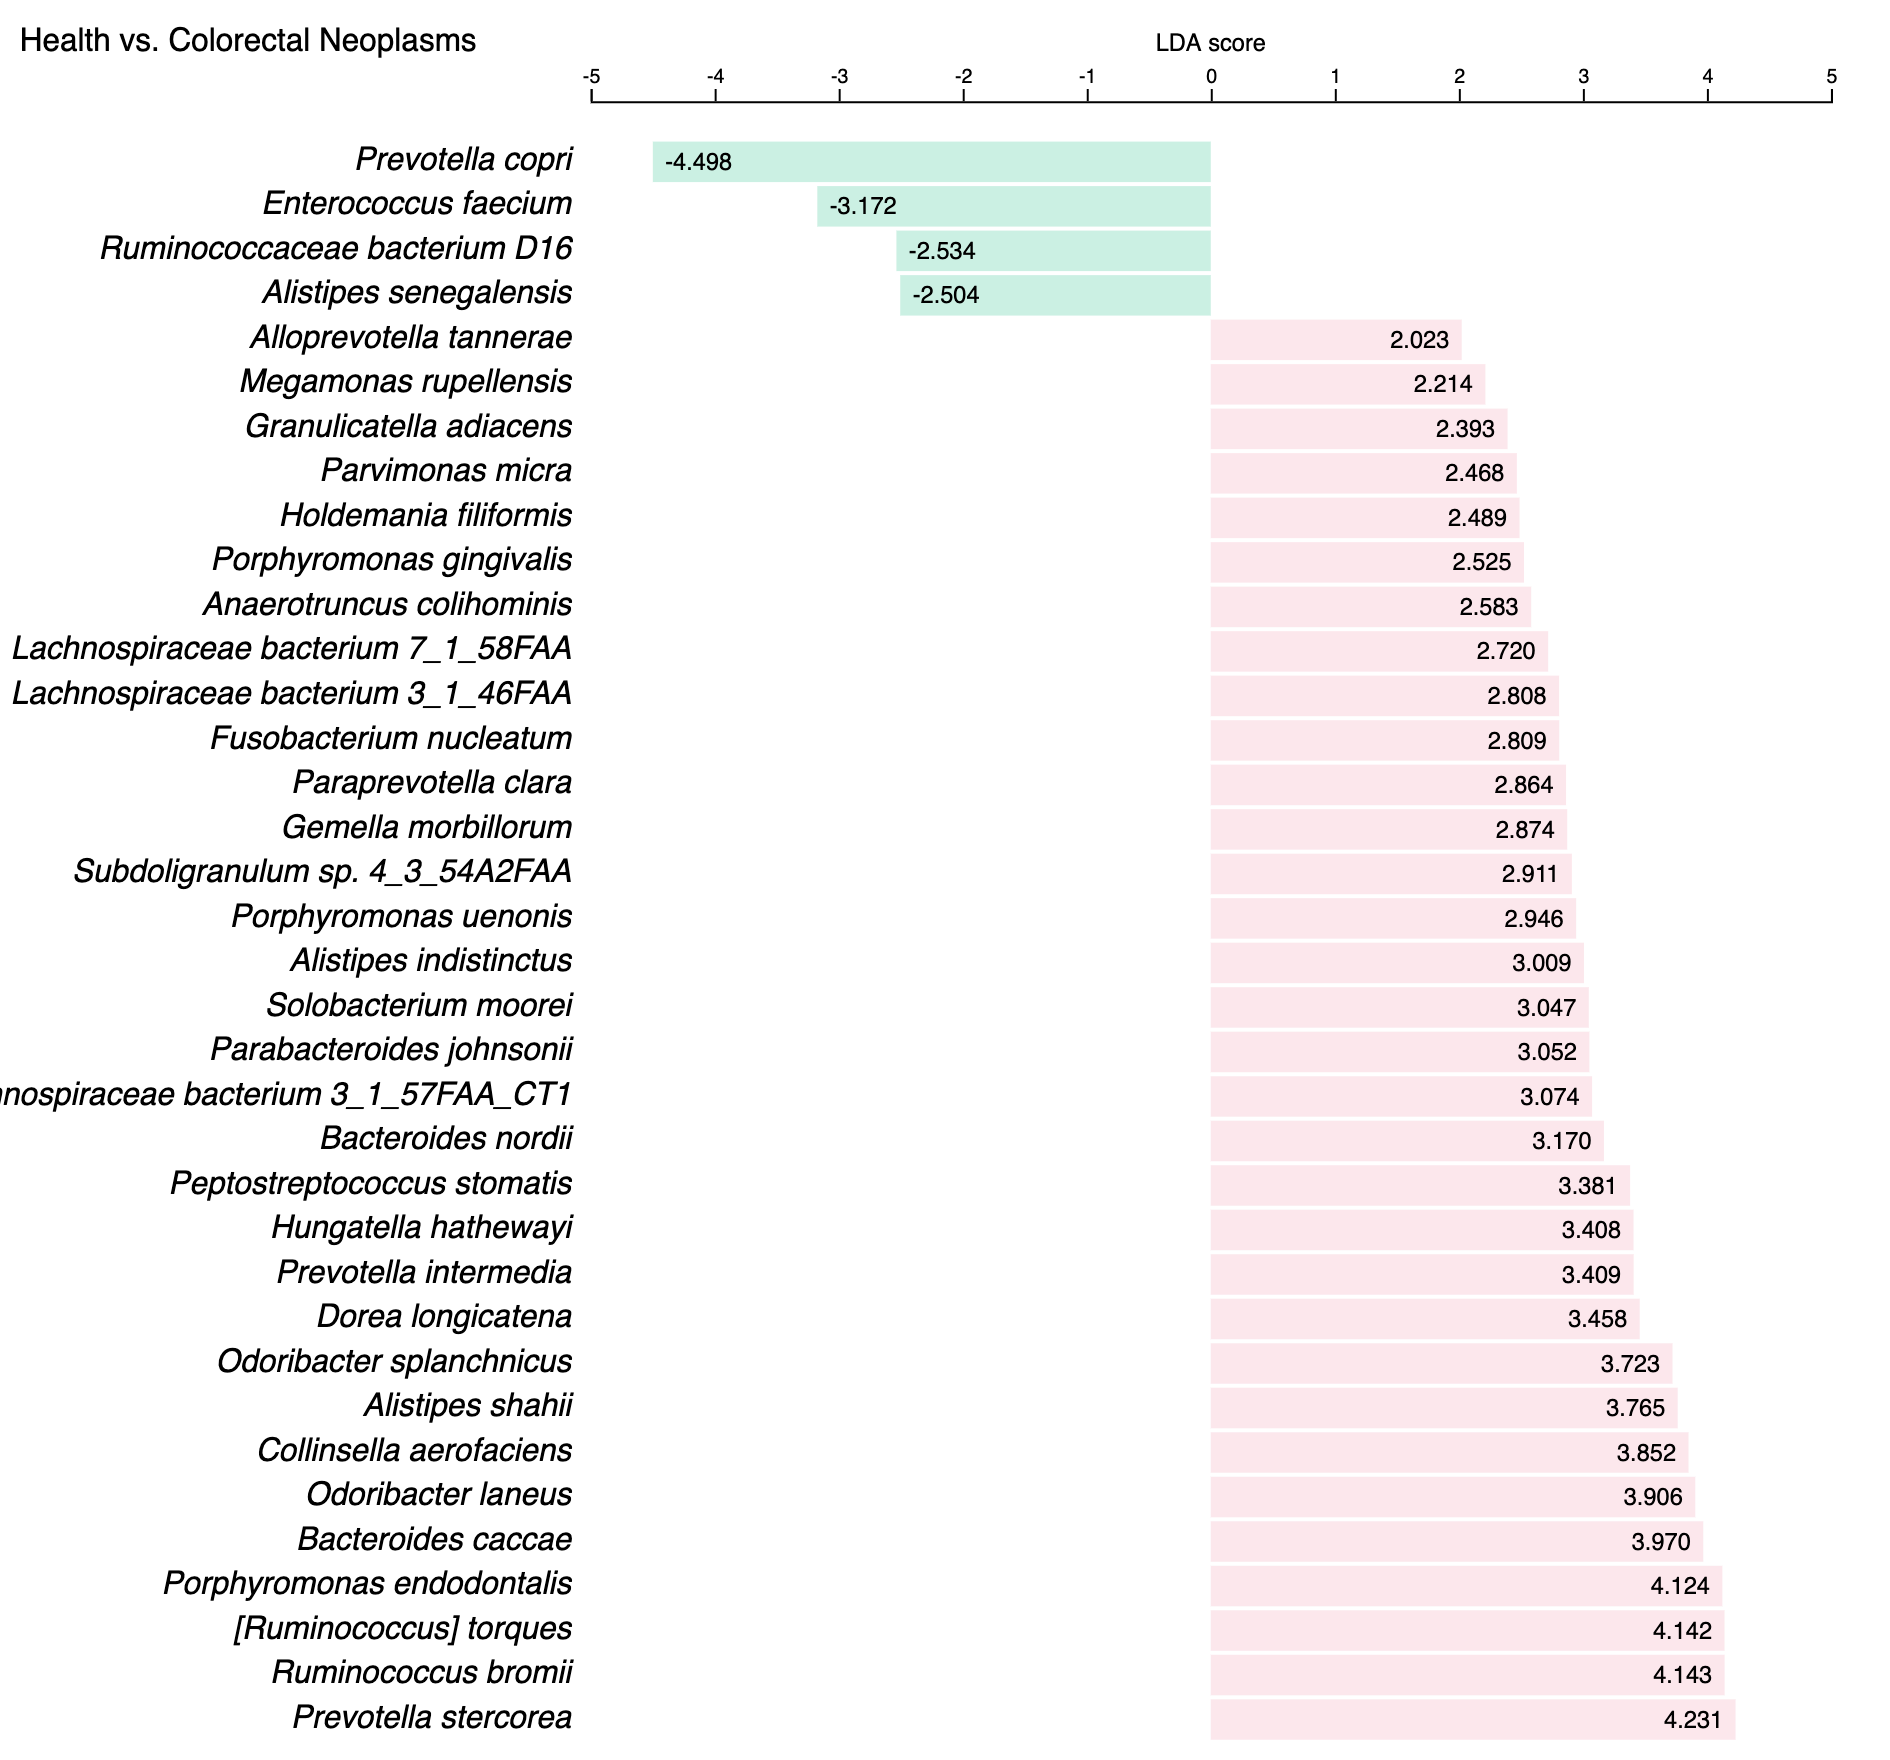
this plot shows marker species that show |LDA score| >= 2.0 between CRC and healthy controls in project PRJDB4176 , in which green (pink) bars indicate health(CRC)-enriched species.
Note
- for whole-genome shortgun sequencing (a.k.a mNGS) projects, markers were identified at both
speciesandgenuslevels; - for 16S amplicon data (a.k.a 16S) projects, markers were identified at only
genus. - users can choose to show either
speciesorgenuslevel markers, or both, by using thecontrol buttonsabove the barplot.
Run details page
This page shows details of a specific run, and includes two parts.
1. Run details and meta-data
This part includes:
- run ID,
- a brief introduction,
- related project ID and sample ID,
- associated disease, and
- meta-data
2. Taxonomic profile
This part shows the taxonomic profile, i.e., the bacterial species/genus identified in the run and their relative abundances.
See ERR481097 for an example.
The relative abundances are visualized as below:
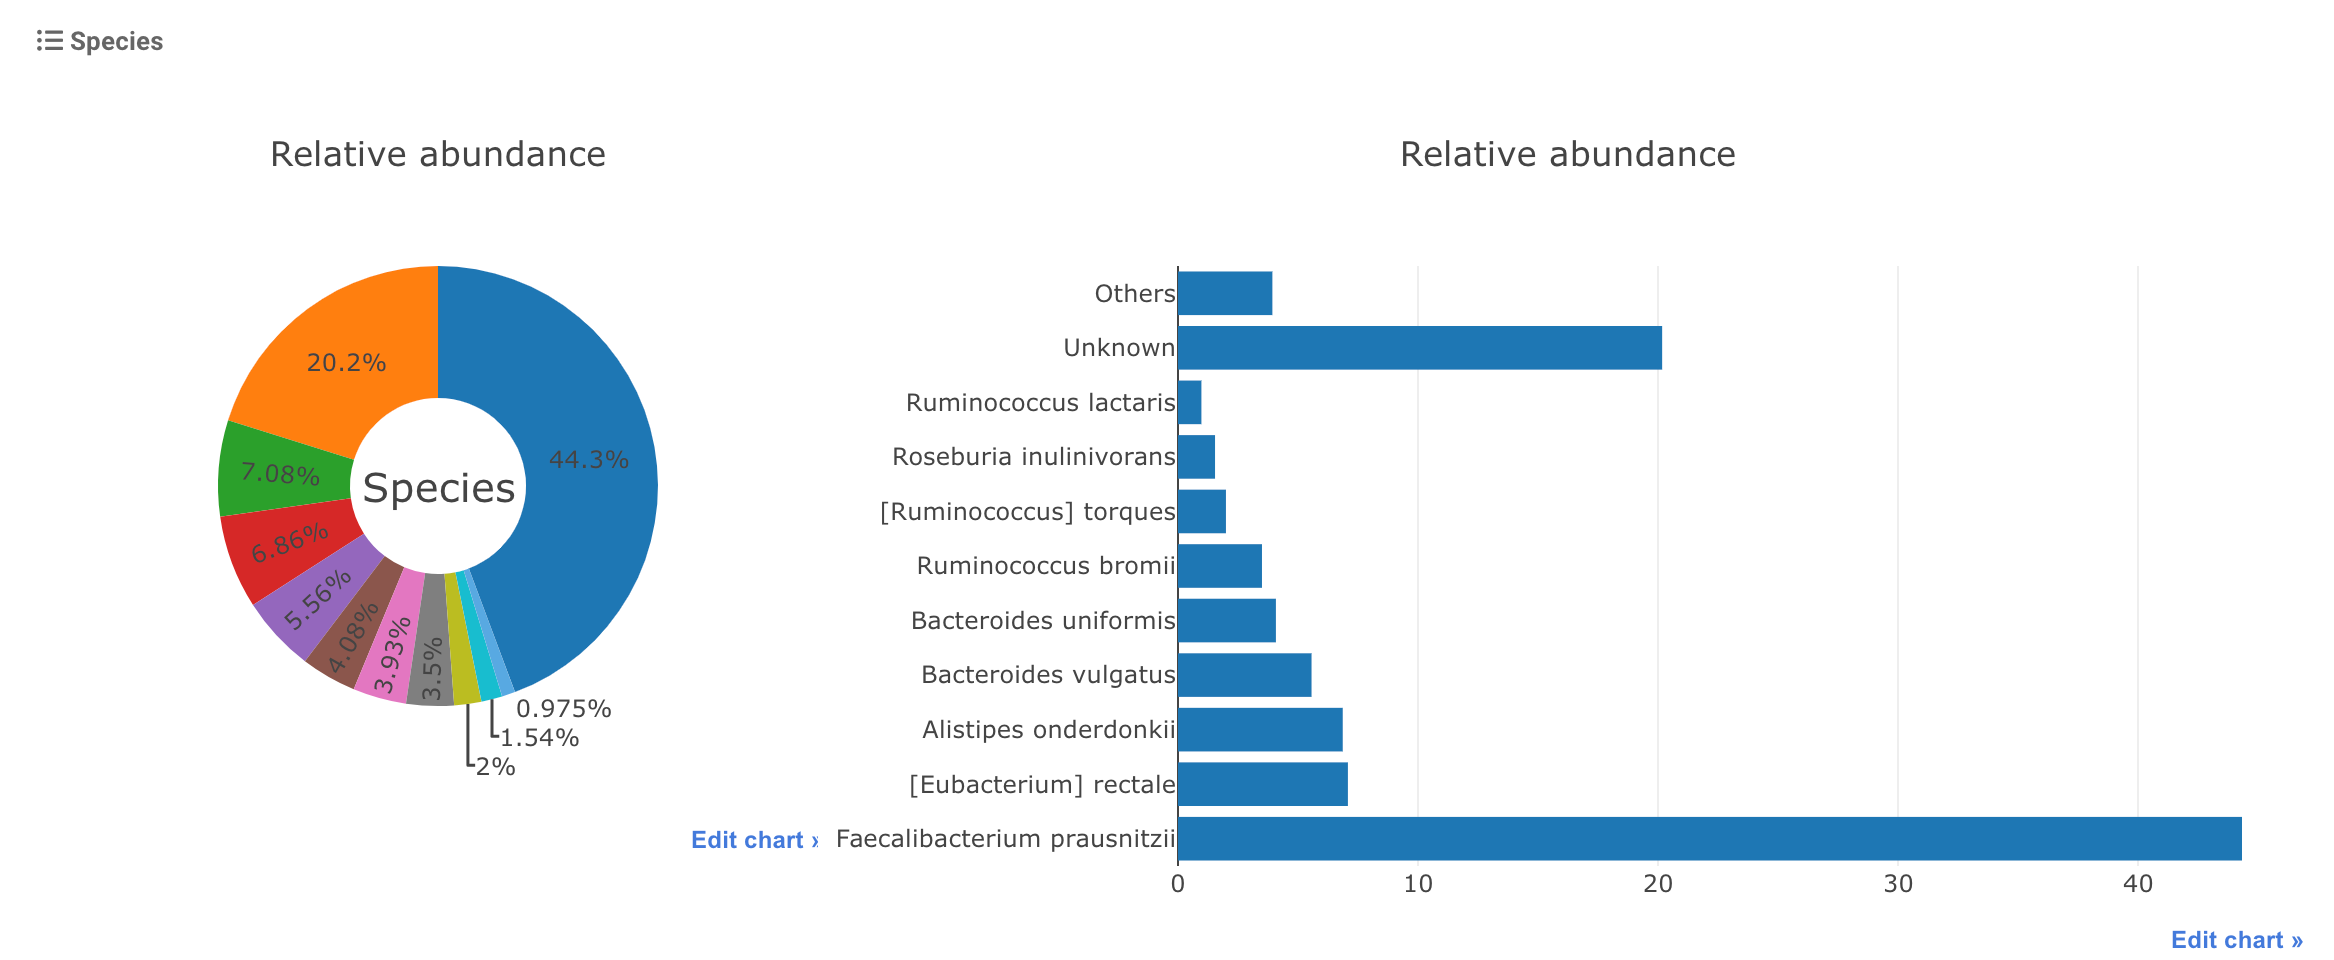
Users can download the detailed profile as a text file using the link below the figures.